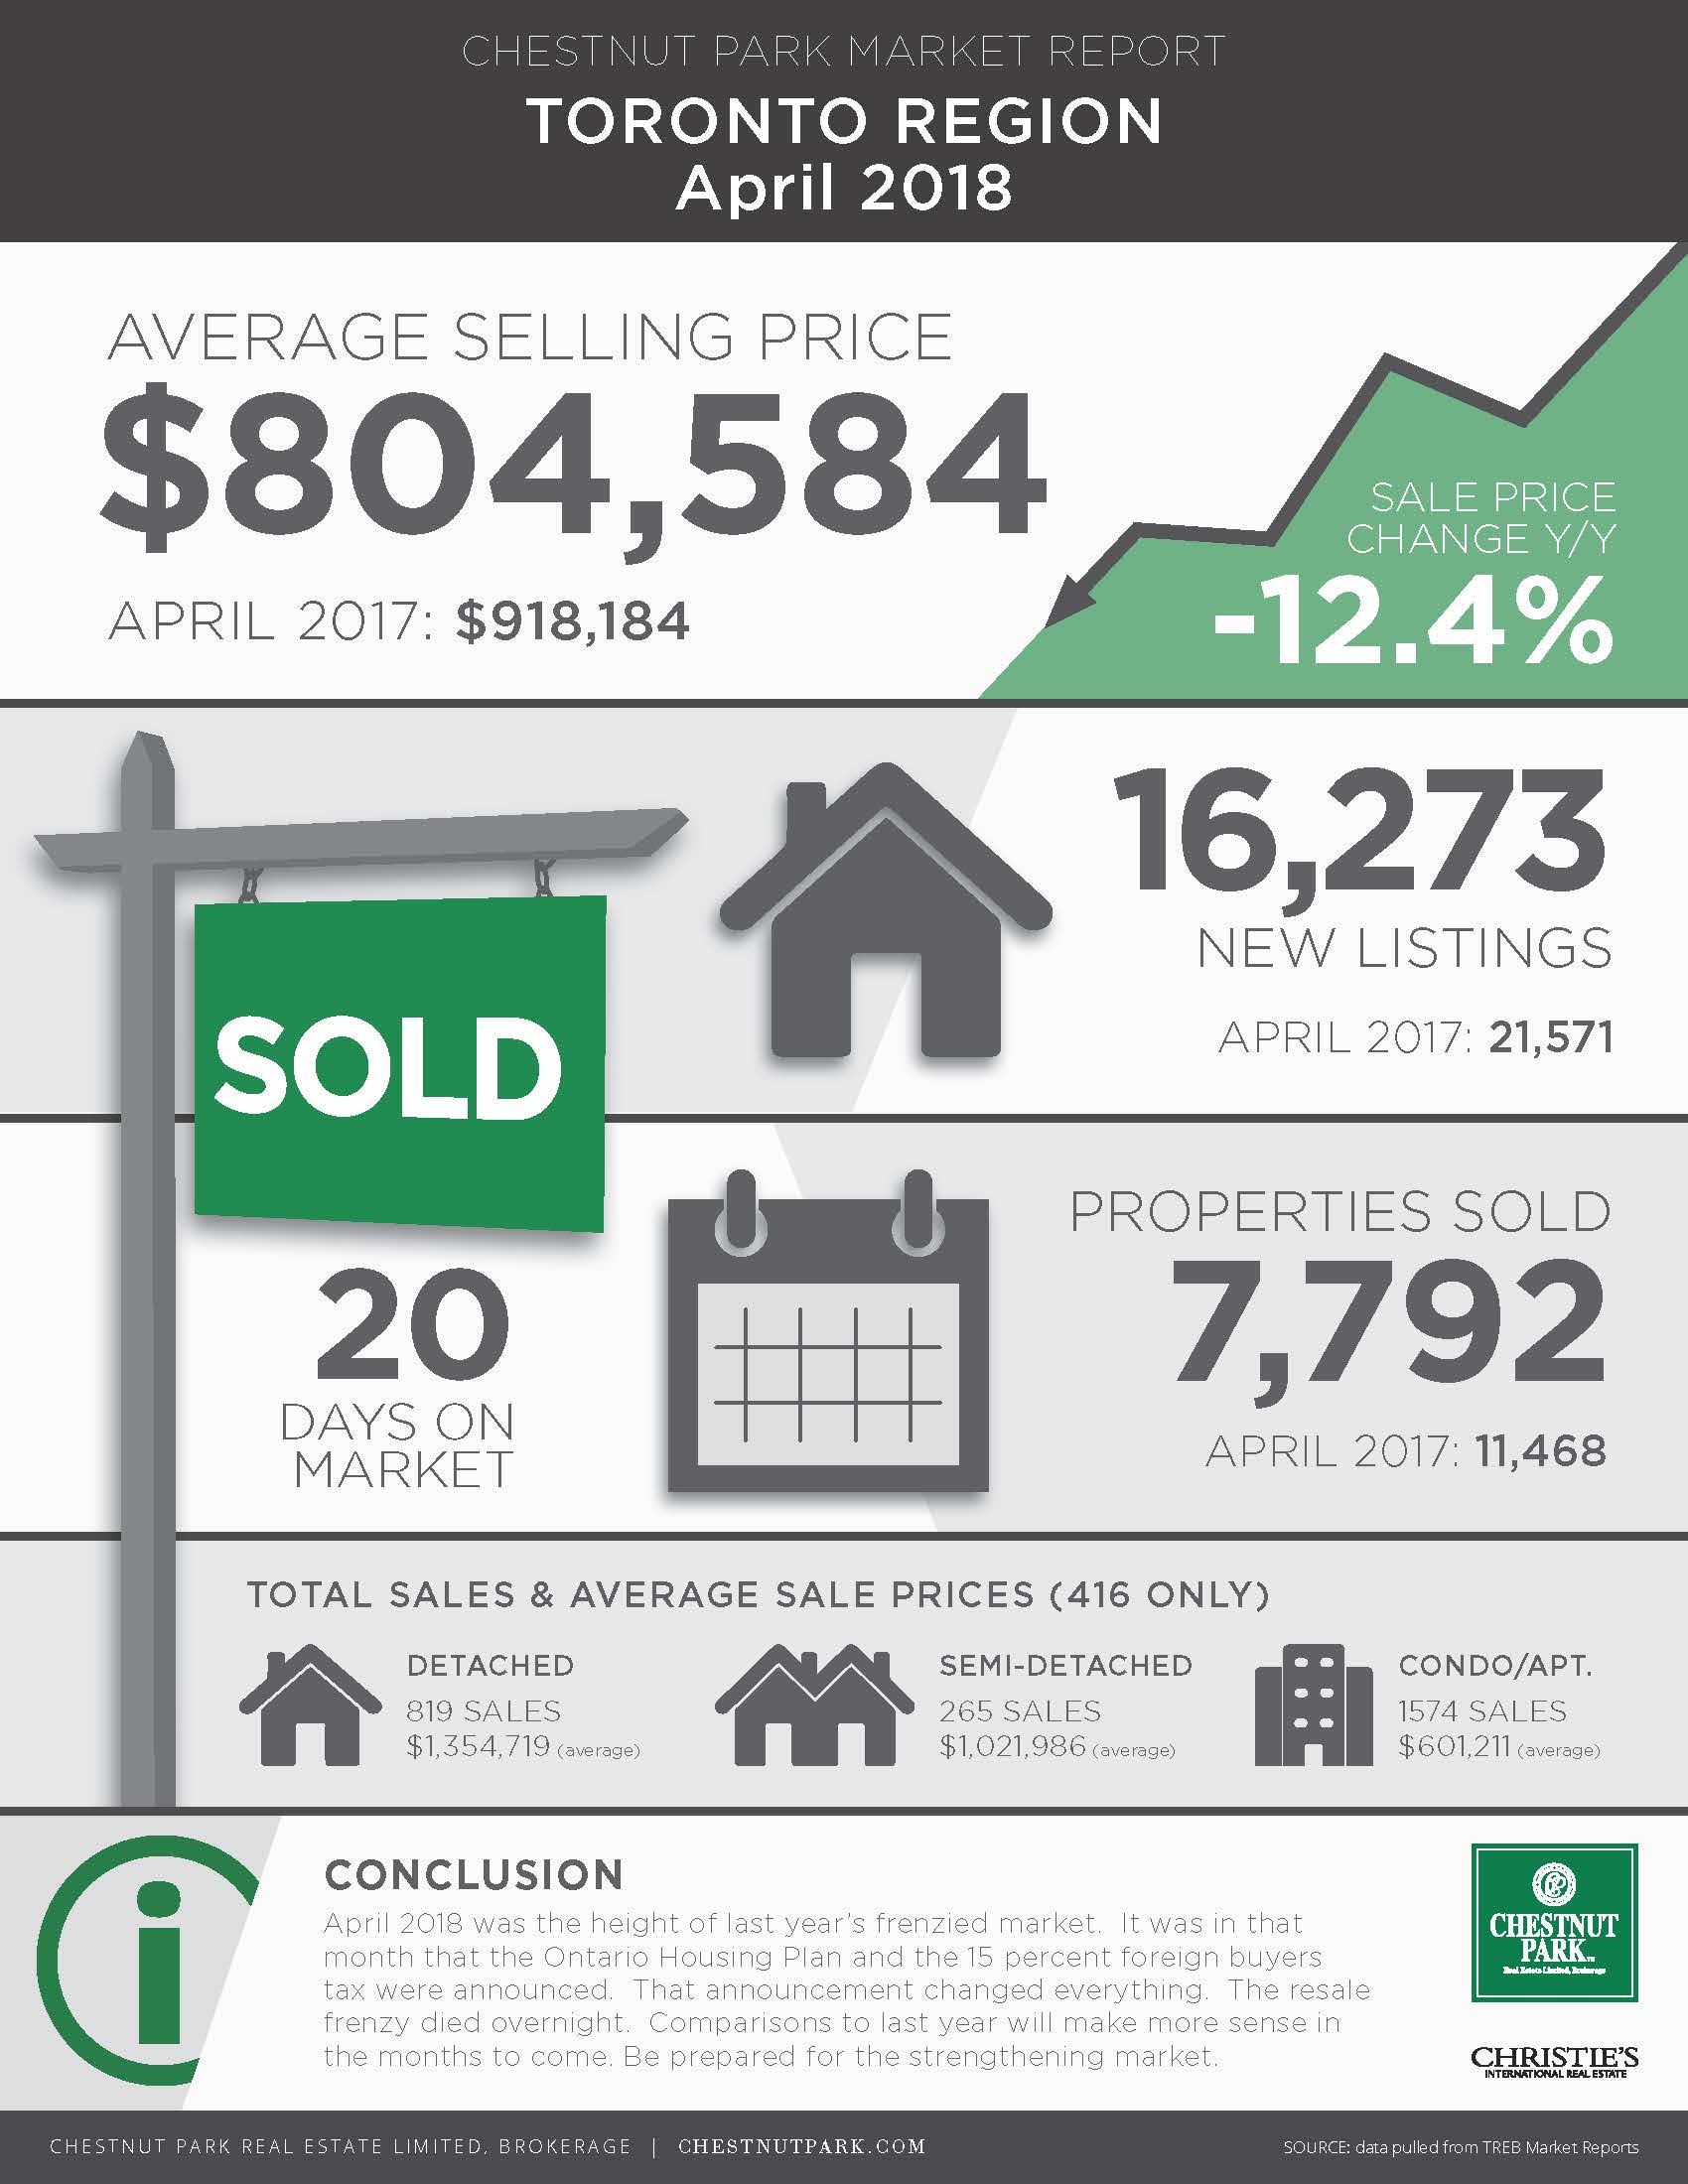
Oh the weather outside is frightful… but the Toronto market is actually doing pretty well. Contrary to some media reports, the Toronto real estate market is actually fairly stable at the moment. Though a lack of inventory is making it harder for buyers, the average sale price for the month of January has stayed fairly steady. For a full read on what’s been happening in the last month, check out the market update from our Chestnut Park’s CEO Chris Kapches…
2019 started positively, surprising many who were anticipating the double-digit declines that the Toronto and area residential resale marketplace delivered in November and December of last year. Although moderate, January delivered increased sales volume and average sale prices compared to January 2018.
There were 4,009 sales reported in January, a less than 1 percent increase compared to 2018, but an increase nonetheless. Encouragingly, January’s positive results were due to an improvement in Toronto’s 905 region. The Greater Toronto Area was dramatically impacted by the provincial foreign buyers’ tax and has lagged behind the Toronto 416 market since the spring of 2017. In January, the 905 region’s sales were up by 2.5 percent compared to last year, while the City of Toronto’s sales declined by 3.5 percent. The decline in City of Toronto sales was not caused by a decline in demand. Rather the decline was driven by a chronic shortage of supply. At the end of January, the Greater Toronto Area had 2.7 months of inventory, whereas the City of Toronto found itself with only 1.9 months of inventory. The difference in inventory is also reflected by the fact that sales in the 905 region took place in 33 days (an average), yet it took only 29 days for all properties in the City of Toronto to sell.
Another positive aspect of January’s performance is the supply of new properties that came to market. In January, 9,456 new properties became available to buyers. This is a favourable 10.5 percent increase compared to the 8,561 new listings that became available last year. Entering February, active listings were slightly higher than last year. February began with 11,962 active listings compared to the 11,894 available last year. The bulk of these listings are located in the 905 region. OF the 11,962 active listings, 8,387, or more than 70 percent, are located in the 905 region.
January’s average sale price came in at $748,328, an increase of almost 2 percent compared to last year’s average sale price of $735,874. This is exactly the kind of increase that reflects a stable and sound market, not the double-digit monthly increases that became commonplace in 2016 and early 2017. Double-digit increases in average sale prices become unsustainable and unfortunately can lead to painful corrections.
In this regard, Toronto’s high-end residential market continues to adjust. In January, 76 properties having a sale price of $2 million or more were reported sold. This compared to 90 reported sold during the same period last year. The adjustment is also evident in the sale price to listing ratio witnessed in January. Detached properties in Toronto’s central districts are the most expensive properties in the Greater Toronto Area. All detached properties in these districts sold for 95 percent of their asking price. This ratio was much lower than the detached properties in other trading districts. For example, all detached properties in Toronto’s eastern districts sold for 100 percent of their asking price. The fact that the average sale price in the eastern districts is half ($916,588) that of the central districts ($1,938,617) is no doubt responsible for this divergence. Higher-end properties accelerated more dramatically during the pre-2017 introduction of the Ontario Fair Housing Plan and are retracting proportionally, especially with the introduction of the 15 percent foreign buyers’ tax.
Condominium apartments continue to be the most affordable housing form, but again, because of supply, average prices continue to increase. In January, the average sale price in the City of Toronto increased by almost 9 percent to $591,444. In Toronto’s central districts, where most condominium apartment sales are located, the average sale price came in at $677,997, a 10 percent increase compared to last year’s prices. In January, there were only 1,738 condominium apartments for sale in the City of Toronto and only 1,093 in Toronto’s central districts where most sales take place. This shortage of supply will continue to put upward pressure on prices, constrained only by affordability.
Although it is a little early in the year to be forecasting for 2019, January’s results – sales volumes, price increases and increases in supply – all point to a healthy 2019. Last year only 77,375 residential properties were reported sold, the lowest number since the recession of 2008. Barring any unexpected economic events this year, we should see between 83,000 and 85,000 reported sales, with average sale prices increasing by about 2-3 percent. January’s average sale price came in at $748,328. Last year’s annual average sale price was $787,000. By year-end, Toronto and area’s average sale price should be approximately $800,000. From a long-term sustainability prospect, we should be thrilled with this number.
PREPARED BY:
Chris Kapches, LLB, President and CEO, Broker


