Posts in Toronto Housing Market
CHESTNUT PARK MARKET UPDATE

September marked a change in the Toronto residential market place. For the first time since April, the average sale price for all properties sold in the greater Toronto area actually rose.

The monthly average sale price had been on a downward spiral ever since the provincial government announced the introduction of a 15 percent foreign buyers tax on April 20th.

AvgSalePrice_Dec2016-Present.png

In September the average sale price came in at $775,546. September’s average sale price was 6 percent higher than August’s average sale price, and almost 3 percent higher than the average sale price achieved in September, 2016. This is a welcome change, and the first step to the resale market’s return to normalcy. Not the frenzied market that we experienced from January through April, but the 2016 market, that saw property values rise in a moderate, sustainable way.

Although the market did recover in September, the recovery remains fractured, with some sub-markets out performing others. On the broadest level, the 416 area code, as a trading district, is outperforming the 905. Sales volumes for the greater Toronto area were down 35 percent compared to last year. This September 6,379 properties were reported sold, last year there were 9,830. Comparing the 416 and 905 trading areas, a different picture emerges.

Whereas the overall market was o by more than 35 percent compared to last year, the 416 trading area had only declined by 29 percent. The 905 trading area did not fair as well, with sales o by almost 40 percent. The same is true for average sale prices.

As indicated above, the monthly average sale price for the greater Toronto area was $775,546, up 2.6 percent compared to last year. On an unweighted basis, the average sale price for all properties sold in the 416 region increased by almost 10 percent compared to last year. In the 905 the increase was slightly less than 6 percent. So clearly the numbers emerging from the 905 region are acting as a downward drag on the results of the overall resale market place.

But even within the 416 trading districts there are regional differences. Sales of detached properties were down by 41 percent in September. The volume of semi-detached properties sales was down by only 15 percent, and 23 percent for condominium apartments. Average sale prices for detached and semi-detached properties rose by 4 and 5 percent respectively compared to September 2016, whereas condominium apartment average sale price rose by 24 percent compared to last year.

Notwithstanding the negative press concerning the Toronto resale market place and its “collapse”, house prices in Toronto continue to be very expensive, but given prevailing interest rates, still sustainable. In September the average price for a detached home in Toronto’s 416 region was $1,355,234. The cost of a semi-detached home was not far behind at $935,467. Even condominium apartments are becoming pricy. In September, the average price for a condominium apartment was $554,069. In Toronto’s central districts, where most of Toronto’s condominium apartment towers are located, the average price for a condominium apartment was $615,654. There were 917 sales in this category, almost 1/6 of the total inventory of properties sold in September. Notwithstanding these elevated prices, all the condominium apartments sold for 100 percent (on average) of their asking price.

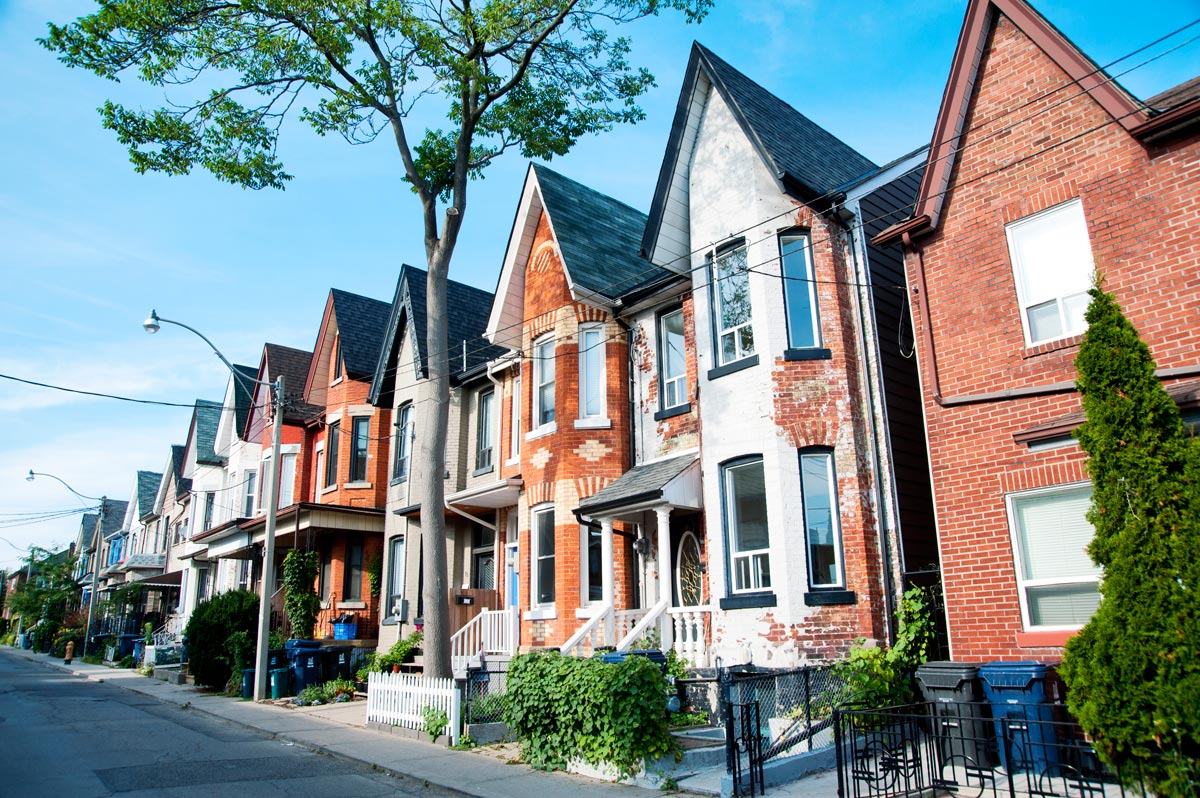
On the freehold side, the region just to the east of the central core, comprising the neighhourhoods known as Riverdale, Leslieville, and the Beaches, continues to trade as if the downturn experienced everywhere else in the greater Toronto area miraculously missed it. In September all detached properties in these areas sold for almost 104 percent of their asking price and in a mere 14 days. Semi-detached properties moved even faster. Semi-detached properties in these neighbourhoods sold in just over 8 days and for sale prices that exceeded the asking price by more than 105 percent. The average sale price of detached and semi-detached properties reported sold in these neighbourhoods was $1,286,000 and $928,000 respectively.

Over the last 5 months the market has moved from an insane seller’s market to a more nuanced, balanced market (except of course in Riverdale, Leslieville, and the Beaches). In September, 16,469 new properties came to market, an increase of more than 9 percent compared to the 15,050 that came to market last year. At the end of September there were 19,021 properties available to buyers, a stunning increase compared to the paltry 11,255 available last year. In percentage terms, availability has increased by 69 percent, year-over-year.

Needless to say, with an increase in supply, both average days on the market and months of inventory have increased dramatically. Year-over-year days on market have increased from 16 to 24 days. Months of inventory, calculated on a 12 month moving average is now 1.5 months for the greater Toronto area. Months of inventory, using September data, is more like 3 months, a much more accurate reflection of the market than the 12 month moving average.

The market is normalizing. It will continue to improve moderately, as year-end approaches. Sellers hoping for the heady days of January through April will be disappointed. In addition to assimilating the impact of the foreign buyers tax, the Toronto market has had to contend with two quarter-point mortgage interest rate hikes, and potentially more to come. There is also the looming threat of additional stress testing which the Office of the Superintendent of Financial Institutions has proposed. All of these factors will have a moderating effect on the residential resale market going forward.

Prepared by:Chris Kapches, LLB, President and CEO, Broker

Toronto Real Estate Market Update Sept 2017 - Infographic.jpg
NOTES FROM THE PRESIDENT: The Weekly Chestnut Park Meeting Recap
toronto-of-tomorrow-rental.jpg

Each week, The Glenn Team provide highlights from the weekly CP office meeting to provide a balanced overview of the Toronto and GTA markets and relevant issues affecting real estate markets. Meetings are overseen by Chestnut Park's CEO and Broker of Record, Chris Kapches, LLB, who provides weekly analysis and commentary. Additional input is provided by the CP Toronto office Realtors who give a day to day, real life perspective of the local markets.

MARKET STATS

The uptick in the average sale price continued through the month of September, giving further credence to what most feel is the end of the plateau and start of a rebounding market. Further support from Chris' stats (the TREB weekly stat filibuster continues) in the first week of October support this as well, as the average sale price in the 416 was around $831,000. The average sale price for the GTA for September was $775, 456, up 2.6% year over year, which would also support a rebound in the market. Average price breakdowns for the 416 based on housing type were as follows...

Detached Houses - $1,355,000 - 5.4% increase yr/yr - 
Semi-detached Houses - $935,000 - 5.2% increase yr/yr
Condo Apartments - $554,000 - 24% increase yr/yr

Prices in the 905 were much less dramatic however, with detached houses only going up by less than 1%. Sales volumes were down by 35% across the GTA, which seems like a high number but put into perspective, those numbers are coming from very high volumes seen in 2016. 61% of the sales that took place in September came from the 416 however, which also had less inventory than the 905, so it should be expected for prices to continue to climb going into 2018.


BUYER BEWARE

As we've mentioned, the psychology of the market may be just as important as the stats themselves, and media reports could go a long way to see this switch in the market's thinking. Chris cited this article from the Globe and Mail which, among some points already mentioned, discusses buyers coming back to the market now after having perceived the downturn to be over. Articles like this will likely cause buyers to promptly return to the market and could cause a dramatic uptick in prices yet again. Of further concern given all of these numbers and trends is that it's likely that OFSI will move forward with the new stress test rules. If you're considering buying in the 416, especially if a condo is the product you're after, we would urge you to get started today! 


IT'S ALL ABOUT BALANCE

Getting perspective on whether the market is balanced or not can be challenging. TREB using a 12 month moving average for month's of inventory -where balance is closer to 1.5 months- to determine whether the market is overheated or not. Chris prefers to use a standard average; where 3.9 months would be considered balanced or heathy. Despite how it's calculated, at the beginning of October, there were about 19,000 properties on the market, giving the 416 about 1.4 months of inventory and the 905 1.5 months. That's 17% more than last October's 11,000 but is still about 1000 listings off a healthier market in Chris' opinion. As we approach the end of year, we’ll be looking at overall sales be around 80-88,000. This is consistent with period b/w 2009-2013 before we saw numbers in the hundreds of thousands. 


EAST VS. WEST

Traditionally, Realtors and the public always felt there were better deals to be had in Toronto East end, but that seems to be less and less true, at least in the case of semi-detached properties. In the Eastern districts, all sales for the month of September came in at 104% of asking with an average of 10 days on the market. The average sale price for semi-detached properties in the East end was $872,326, vs. the Western districts which averaged $775,663. However, the average sale price for detached properties, which have great prevalence in the West, was $1,015,711 vs. $961,805 in the East. So clearly it's currently better to go West to buy a semi-detached property currently. Contrast that with condo apartments with sales prices on average being about $50,000 less on the East end than the West. For further contrast, the Central districts saw an average sale price of $615,654 for condo apartments. 


MULTIPLE REPRESENTATION STAYS UNIFIED

News regarding how the Ontario government will treat instances of multiple representation (where one Realtor represents both parties in a transaction) came back from OREA. The decision will keep in place the existing rules for how Realtors working with both sides to a real estate transaction are defined. Chris, OREA and most Realtors and brokerages see this as a win for both Realtors and the public. The alternative would have required that a second Realtor represent one side in the transaction so as to avoid potential conflicts of interest. However, that scenario could give way to Realtor alliances and potentially fewer buyers for those buying or selling in smaller, localized markets. The new legislation will allow one Realtor to represent both parties so long as informed consent is given on the part of the buyer and seller. It is expected that OREA will draft new forms to give consent in transactions requiring multiple representation. 

Do you feel like this was the right decision? We'd love to hear your comments! 

NOTES FROM THE PRESIDENT: THE CP WEEKLY MEETING RECAP
RealEstatephotos_Hr_v2-158.jpg

Each week, The Glenn Team provide highlights from the weekly CP office meeting to provide a balanced overview of the Toronto and GTA markets and relevant issues affecting real estate markets. Meetings are overseen by Chestnut Park's CEO and Broker of Record, Chris Kapches, LLB, who provides weekly analysis and commentary. Additional input is provided by the CP Toronto office Realtors who give a day to day, real life perspective of the local markets.

MARKET ANALYSIS

Because TREB has continued it's weekly/mid-month stats fillabuster, Chris has created his own analysis method based on MLS data for the 416 only. As September progressed, there were more active sales and avgerage sale prices were up. As an example, b/w Sept. 22nd and 29th, the average sale price increased from about $782,000 to $809,000. Between August and September, sales volume also increased from 2480 to 2514 properties. That 2% increase coupled with an 11% increase in average sale price from August is the first time in 4 consecutive months that we've seen a positive variance in both categories.

Additionally, The Bank of Canada posted yet another increase in interest rates and though the press says that may be the last we'll see before 2018, Darlene Hanley of Hanley of Hanley Mortgage Group, says they're expecting at least one more before year's end. Couple that with the new proposed stress test which, will require those paying less than 20% down to qualify at a rate of 4.94% and one would expect that sale prices won't reach the bloated values seen in April; we're still about $160-170,000 off the pace from there.

So for the moment, we seem to be headed into a healthier market. However, CP Realtors working in the 416 are reporting high numbers at open houses and buyers feeling a need for more product, so at least in the 416, we're likely to continue to see market activity and sales numbers increase. Contrast that with the 905, where at least one Realtor representing a prime property had less than 4 showings in 4 weeks. The hope is that any increase in sales going into 2018 in both the 416 or 905 areas will be sustainable (in the 3-5% range) and not the 11-20% range that got us here.

BANKABLE RESULTS

In a report published by CIBC, economists are coroborating Chris' sentiments for a rebounding Toronto market, siting Toronto's sale prices increasing, economic growth rates of 4.5% and lower unemployment numbers. The report indicated that 90% of home buyers are earning between $58-108,000/yr. (classified "middle-class"), and about 75% of mortgage holders made downpayments of 10% or more. An analysis run by Chris from 2010 indicates that Toronto home owners have been prudent in their housing purchases given the relative increase in average sales prices since that time and the releatively consistent interest rates from that time to today. All of this would seem to corelate with the data coming from CIBC. 

RBC economists however, feel that Toronto will follow Vancouver's market recovery, which only recently posted year over year gains of 22%. However Chris was quick to point out that those gains were seen before further increases in bank rates. That kind of growth would be reminiscent of April's gains which Chris called "a terrible period and not something we want to experience again". 

Have a differing perspective on the market? We'd love to hear from you! Feel free to comment below or send us an email at theglennteam@chestnutpark.com