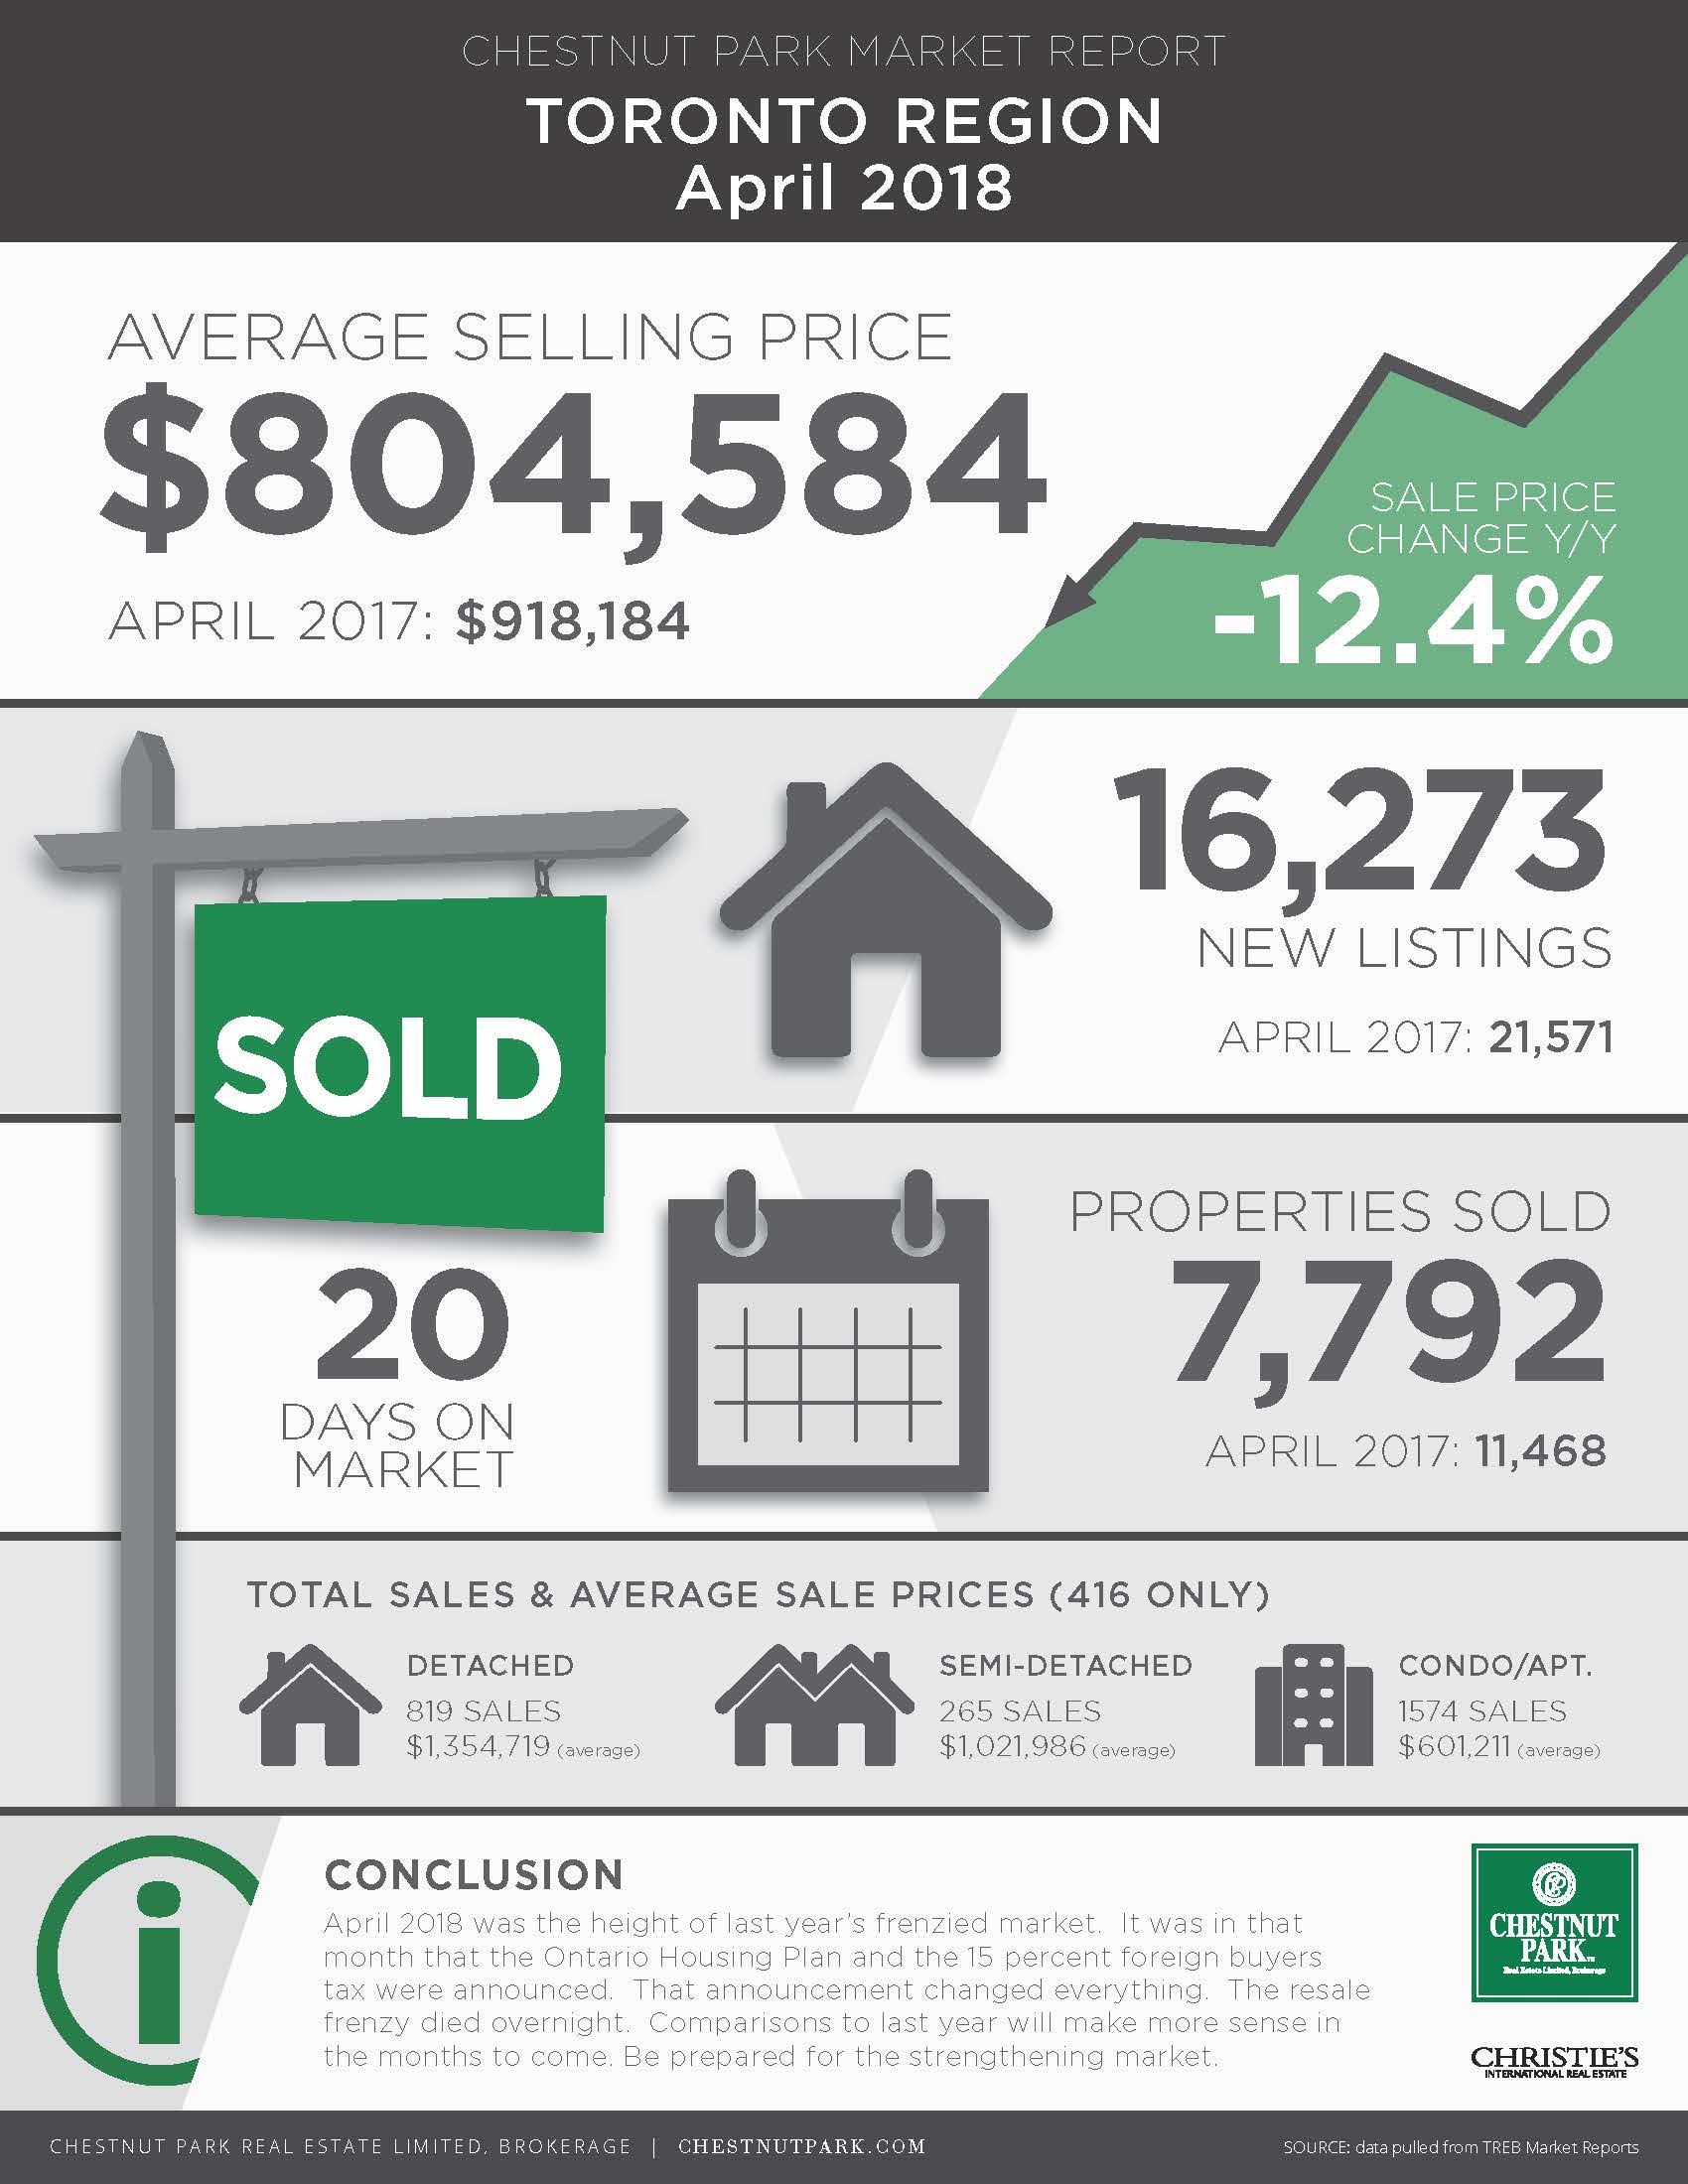
If you haven't been tracking the sales stats in Toronto over the past months - let's face it, stats are kinda boring so we expect you haven't - you can check out this slick infographic produced by the fine people in our marketing department; yet another perk of working with a Chestnut Park Realtor.
Condos continue to increase in price as the most affordable product on the market up to their average in April of $601,211 (+3.5% from March!). But more shocking perhaps is the overall Average Sale Price for Toronto, which is approaching something similar to last April when the market saw it's highest highs of all time. What does this mean? That the correction was just that and that buyers still hold Toronto real estate in high regard.
If you're wondering where you stand as a buyer or where your property stands as a seller, please get in touch today for a free consultation. We're always happy to help!